
The ranking is restricted to pure asset owners: public pension funds, sovereign wealth funds and large insurance general accounts whose primary purpose is long-term investment return. Central-bank reserve portfolios are excluded. Different financial year-ends are accepted and noted. Currency conversions use rates proximate to each reporting date.
Top 10 Asset Owners in APAC (Latest available primary-source data, mid-October 2026)
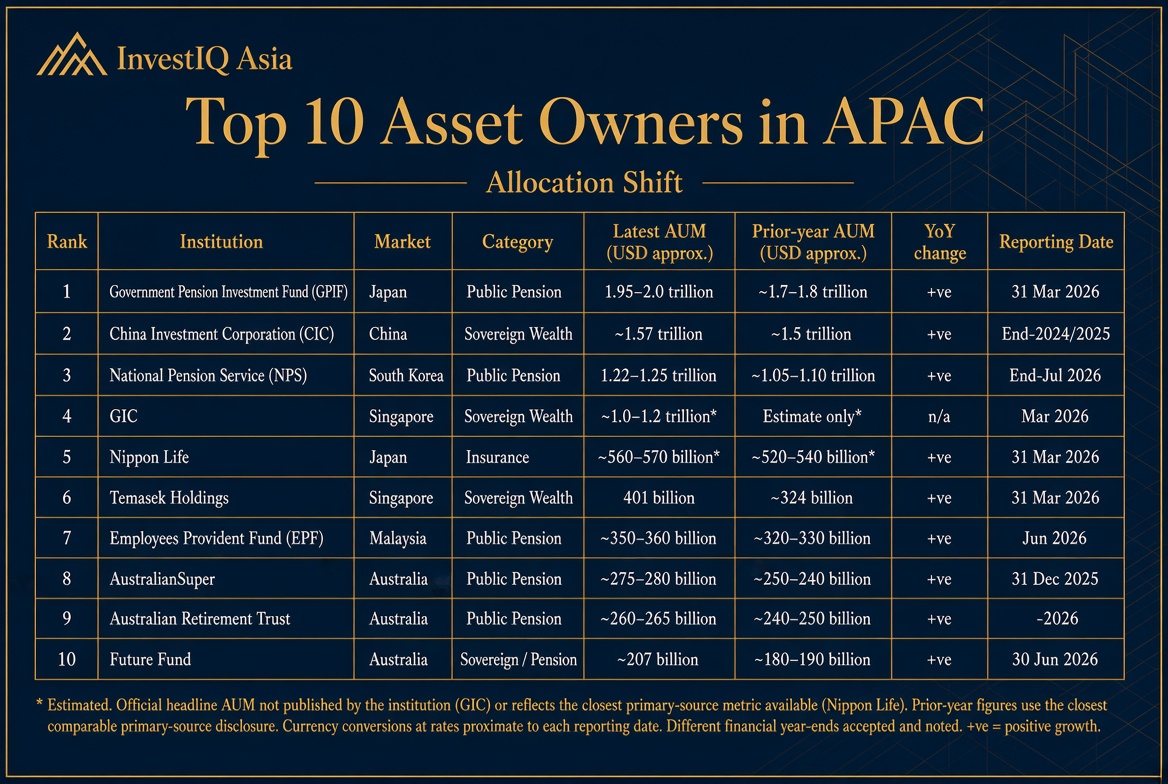
Absolute growth is widespread. Temasek’s net portfolio value rose from approximately US$324 billion to US$401 billion. The Future Fund reached a record A$289.7 billion, driven by a 14.8 per cent return in the year to 30 June 2026. AustralianSuper and Australian Retirement Trust both expanded on a comparable basis. NPS assets increased from the end-2025 level despite a sharp intra-year pull-back in July 2026. EPF and Nippon Life also recorded positive growth on their respective reporting bases.
The combination of rising scale and rising equity weights has practical consequences. Larger pools with higher equity and alternatives exposures become more important counterparties for private equity, infrastructure and real-asset managers, and more significant sources of flow in public markets.
Japan – GPIF
Assets of approximately ¥293.6 trillion (US$1.95–2.0 trillion) as of 31 March 2026. The actual allocation remained close to the long-standing policy mix of 25 per cent each in domestic bonds, foreign bonds, domestic equities and foreign equities. Alternatives stay capped at 5 per cent. The fund continues to operate within a tightly defined policy framework, with only limited tactical deviation permitted.
South Korea – NPS
KRW 1,684.2 trillion (US$1.22–1.25 trillion) as of end-July 2026. Equity exposure has crossed and remained above 50 per cent: global equities 37.0 per cent, domestic equities 24.9 per cent. Alternatives stood at 14.8 per cent. The multi-year shift out of domestic fixed income into global equities and alternatives is progressive and well documented in successive official portfolio reports.
China – CIC
Cited at around US$1.57 trillion on the basis of the most recent official disclosures. Public granularity on asset-class weights remains limited relative to the Japanese and Korean peers.
Singapore – GIC and Temasek
GIC does not publish a headline AUM. Its strategic allocation is stated as 56 per cent equities, 22 per cent fixed income and 22 per cent real assets. Temasek reported a net portfolio value of S$518 billion (US$401 billion) as of 31 March 2026, up from the prior-year equivalent of approximately US$324 billion. The Temasek Review provides sector and geographic composition rather than a conventional public-pension asset-class percentage table.
Australia – The Three Largest Pools
AustralianSuper stood at A$410 billion (approximately US$275–280 billion) as of 31 December 2025. Australian Retirement Trust managed approximately A$370–375 billion in mid-2026. The Future Fund reached A$289.7 billion as of 30 June 2026. Its year-on-year allocation comparison shows global developed equities rising from 25.8 per cent to 29.1 per cent, private equity easing from 13.3 per cent to 12.1 per cent, and alternatives remaining stable near 14.7–14.9 per cent. Australian equities accounted for 10.5 per cent.
Malaysia – EPF
Investment assets of RM1.53 trillion as of June 2026. Global investments accounted for 39 per cent of the portfolio. Equities generated the majority of investment income in the first half of the year. Domestic assets remain the larger share, but the global weighting has continued to increase.
Japan – Nippon Life
Included at approximately US$560–570 billion on the basis of the closest primary-source metric available as of 31 March 2026. Insurance premium floats differ structurally from pure pension or sovereign portfolios, yet the scale places Nippon Life among the region’s largest institutional owners.
Australia, Japan and Korea provide the clearest year-over-year asset-class visibility. Singapore’s sovereign vehicles report strategic rather than granular shifts. Taiwan’s Bureau of Labor Funds publishes detailed monthly utilisation data (approximately US$280–290 billion in mid-2026) but not an identical standardised percentage table. Hong Kong and Thailand lack single pure asset owners of equivalent scale that meet the ranking criteria. The Exchange Fund remains excluded as a central-bank reserve vehicle.
Equity weights have become a more structural feature of the largest public pools across the region.
The largest pools of Asia-Pacific capital are simultaneously larger and more equity- and alternatives-oriented than five years ago. This alters the competitive landscape for co-investment access, secondary-market liquidity and the relative attractiveness of listed versus private strategies. Managers seeking to serve these institutions face a higher bar on demonstrated capacity in the asset classes that are being structurally overweight. For private banks, external asset managers and family offices, the direction of travel at the top ten sets the tone for product demand and partnership opportunities across the region.
The next expansion of the ranking will move toward a verified Top 20–25 once additional primary-source reports are incorporated. Until then, these ten institutions remain the dominant capital pools whose allocation decisions shape regional market structure.